|
| |
 TG/Plus Brochure
SERIES 101 TG/PLUS ANALYZER
The TG/PLUS ANALYZER is currently not being built for sale.
Advanced Fuel Research, Inc. does offer a testing service using the instrument
(where samples are sent to our Connecticut-based laboratories). If you have a
need for TG-FTIR measurements, please contact us.
The TG-FTIR Method
The TG-FTIR instrument consists of a thermogravimetric analyzer (TG)
coupled with a Fourier-Transform Infrared (FTIR) spectrometer for the analysis of evolved
gases. The TG-FTIR method has been developed at Advanced Fuel Research, Inc. (AFR) for the
study of low heating rate pyrolysis of coal, but has also been found useful in other
applications. A detailed description of the technique and some of the applications can be
found in references [1-3]. Other relevant publications are references [4-15].
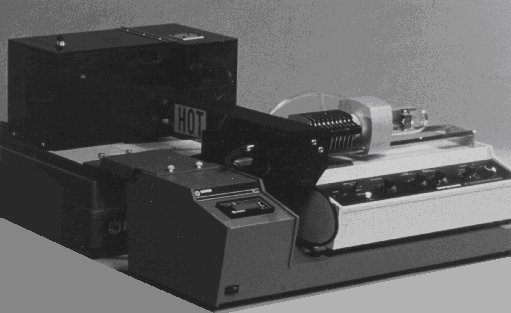
Figure 1. A schematic diagram of the
TG-FTIR system.
The apparatus, illustrated schematically in Figure 1, consists of a
sample suspended from a balance in a gas stream within a furnace. As the sample is heated,
the evolving volatile products are carried out of the furnace directly into a 5 cm
diameter gas cell (heated to 150 °C) where the gases are analyzed by FT-IR spectroscopy.
The FT-IR spectrometer can obtain spectra every 40 seconds to determine quantitatively the
evolution rate and composition of several hydrocarbon compounds. The system allows the
sample to be heated on a pre-programmed temperature profile, at rates 3–100 °C min-1,
up to a temperature between 20 °C and 1100 °C. Isothermal steps with a
specified hold time are also possible. The system continuously monitors: (1) the
time-dependent evolution of the gases (including specific identification of the individual
species such as, CH4, C2H6, C2H4, C2H2,
C3H8, benzene, etc.); (2) the heavy liquid (tar) evolution rate and
its infrared spectrum with identifiable bands from the functional groups (Figure 2); and
(3) weight of the non-volatile material (residue). Quantification of other volatile
species is also possible. An analysis of C, H, N, S and Cl in the residue at the end of
the pyrolysis experiment can be obtained by introducing oxygen to burn the residue and
analyzing the combustion products.
As an example of the analysis procedure, the pyrolysis and oxidation of
a lignite is described (Figure 3). A 35 mg sample of Indian Head Zap lignite, is taken on
a 30 °C/min temperature excursion in helium, first to 150 °C to dry the sample, then to
900 °C for pyrolysis. After cooling, a small flow of O2 is added to the
furnace at the 57 minute mark, and the temperature is ramped to 700 °C (or higher) for
oxidation. Figure 3a illustrates the weight loss from this sample as well as the
temperature history. Infrared spectra are obtained once every forty-one seconds. The
spectra show absorption bands for CO, CO2, CH4, H2O, SO2,
COS, C2H4, HCl, NH3, and HCN. The spectra above 400 °C
also show aliphatic, aromatic, hydroxyl, carbonyl and ether bands from tar. The evolution
of gases derived from the IR absorbance spectra are obtained by a quantitative analysis
program. The aliphatic region is used for the tar evolution peak. Quantitative analysis of
tar is performed with the aid of the weight-loss data. Figure 3b illustrates the integral
of the evolution curves to obtain cumulative evolved product amounts. Because the data are
quantitative, the sum of these curves match the weight loss as determined by the TG
balance. Examples of the evolution curves for selected species are shown in Figure 4.
These data can be used to derive kinetic expressions for the release of particular
gaseous products. The kinetic data can then be used as input to the Functional-Group
Depolymerization, Vaporization, and Cross-linking (FG-DVC) model. The FG-DVC model is
AFR's advanced pyrolysis code which has been shown to provide good predictions for
high-heating rate processes [4-16].
Figure 2. TG-FTIR analysis of lignite: (a) temperature
history and
weight loss; (b) species contributions to weight loss.
Figure 3. Spectra obtained during the TG-FTIR pyrolysis
of coal.
The heating rate is 0.5 °C min-1 from 20 °C to 900 °C. The remaining
char is then burned at 700 °C.
Figure 4. TG-FTIR pyrolysis data: evolution rates of
several species
(wt%/min as-received basis; Pittsburgh coal, dp < 150 mm, heating rate 30 °C
min-1).
Circles are experimental data and lines represent the FG-DVC model predictions.
Y is the total yield of a given species (model predictions are given in
parentheses).

References:
-
Carangelo, R. M., Solomon, P. R. and Gerson, D. J., "Application of
TG-FTIR to study hydrocarbon structure and
kinetics", Fuel 66, 960 (1987).
-
Whelan, J. K., Solomon, P. R., Deshpande, G. V., Carangelo, R. M.,
"Thermogravimetric Fourier Transform Infrared Spectroscopy (TG-FTIR) of petroleum
source rock - initial results,"Energy & Fuels 2, 65
(1988).
-
Carangelo, R. M., Solomon, P. R., Bassilakis, R., Gravel, D.,
Baillargeon, M., Baudais, F., and Vail, G., "Applications of TG-FTIR in the
analytical laboratory", American Laboratory, p. 51 (1990).
-
Solomon, P. R., Serio, M. A., Carangelo, R. M.,
Bassilakis, R., Yu,
Z. Z., Charpenay, S. and Whelan, J., "Analysis of coal by
thermogravimetry–Fourier transform infrared spectroscopy and pyrolysis
modeling," J. Analytical and Applied Pyrolysis 19, 1–14 (1991)
-
Solomon, P. R., Serio, M. A., Carangelo, R. M., Bassilakis, R.,
Gravel, D., Baillargeon, M., Baudais, F., and Vail, G., "Analysis of the Argonne
premium coal samples by TG-FTIR," Energy & Fuels 4 (3), 319 (1990).
-
Whelan, J., Carangelo, R. M., Solomon, P. R. and Dow, W. G.,
"TG/plus - a pyrolysis method for following maturation of oil and gas generation
zones using Tmax of methane," Adv. in Org. Geochem. 16
(4-6), 1187–1201 (1990).
-
Bonanno, A. S., Bassilakis, R. and Serio, M., "TG-FTIR methods
for the evaluation of lubricant contamination," ACS Div. of Fuel Chem. Prepr. 41
(1), 62–70 (1996).
-
Teng, H., Serio, M. A., Bassilakis, R., Knight, K. S., Bates, S. C.,
and Solomon, P. R., "The application of FT-IR methods to the characterization of coal
liquefaction process streams," ACS Div. of Fuel Chem. Prepr. 37 (4),
1903 (1992).
-
Serio, M. A., Bassilakis, R. and Solomon, P. R., "Use of
TG-FTIR analysis for the characterization of fuels and resources," ACS Div. of
Fuel Chem. Prepr. 41 (1), 43–50 (1996).
-
Serio, M. A., Solomon, P. R., Yang, Y. P., and Suuberg, E.
M., "The use of TG-FTIR analysis to determine char combustion properties,"
presented at the AIChE Annual Meeting, Chicago, IL (1990).
-
Carangelo, R. M., Serio, M. A., Solomon, P. R., Charpenay,
S., Yu, Z. Z. and Bassilakis, R., "Coal pyrolysis: measurements and modeling of
product evolution kinetics and char properties," ACS Div. of Fuel Chem. Prepr.
36 (2), 796 (1991).
-
Charpenay, S., Serio, M. A., Bassilakis, R. and Solomon, P.
R., "Systematic trends in pyrolysis product evolution with coal maturity," in Coal
Science: Proceedings of the Eighth International Conference on Coal Science (J. A.
Pajares and J. M. D. Tascón, Eds.), Coal Science and Technology, vol. 24,
Elsevier,
Amsterdam, 1995, pp. 227–230.
-
Charpenay, S., Serio, M. A., Bassilakis, R. and Solomon, P.
R., "Influence of maturation on the pyrolysis products from coals and kerogens –
1. Experiment," Energy & Fuels 10, 19–25 (1996).
-
Bassilakis, R., Zhao, Y., Solomon, P. R. and Serio, M. A.,
"Sulfur and nitrogen evolution in the Argonne coals: experiment and modeling," Energy
& Fuels 7, 710–720 (1993).
-
Serio, M. A., Wójtowicz, M. A., Bassilakis, R., Chen, Y.,
Charpenay, S. and Jensen, A., "Measurement and modeling of coal quality
effects," presented at the EPRI-sponsored Fifth International Conference on the
Effects of Coal Quality on Power Plants, Kansas City, KS, 20–22 May, 1997
-
Zhao, Y., Serio, M. A., and Solomon, P. R., "Modeling
the devolatilization of large coal particles," in Coal Science: Proceedings of the
Eighth International Conference on Coal Science (J. A. Pajares and J. M. D.
Tascón,
Eds.), Coal Science and Technology, vol. 24, Elsevier, Amsterdam, 1995, pp. 833–836.
-
Zhao, Y., Serio, M. A., and Solomon, P. R., "A priori
simulation of coal pyrolysis experiments based on coal elemental compositions," ACS
Div. of Fuel Chem. Prepr. 39 (2), 569 (1994).
-
Solomon, P. R., Hamblen, D. G., Serio, M. A., Yu, Z. Z., and
Charpenay, S., "A characterization method and model for predicting coal conversion
behavior," Fuel 72 (4), 469 (1993).
-
Solomon, P. R., Hamblen, D. G., Carangelo, R. M.,
Serio, M.
A., and Deshpande, G. V., "A general model of coal devolatilization," Energy
& Fuels 2, 405 (1988).
-
Wójtowicz, M. A., Zhao, Y., Serio, M. A., Bassilakis, R.,
Solomon, P. R. and Nelson, P. F., "Modeling of hydrogen cyanide and ammonia release
during coal pyrolysis," in Coal Science: Proceedings of the Eighth International
Conference on Coal Science (J. A. Pajares and J. M. D. Tascón, Eds.), Coal Science
and Technology, vol. 24, Elsevier, Amsterdam, 1995, pp. 771–774.
|